Creating a Roulette Strategy Simulator: A Simple Guide
As many of our readers know, we don't just analyse different roulette strategies; we also put them to the test. To do this, we rely on roulette simulators. These tools help us determine whether a strategy is effective in the short term and long term. With these simulators, we can adjust variables like the number of players, starting balance, spin count, and betting patterns to see how well each strategy holds up.
You can try this yourself without purchasing a specialised roulette simulator. All you need are two things: Google Sheets and a bit of your time. Below, we’ll guide you step-by-step on how to set up a roulette simulator using Google Sheets.
- 1
Step 1 – Set Your Strategy Parameters. Before you dive into Google Sheets, you’ll need to outline the parameters for your simulation. This means defining how your strategy will function – for example, what kinds of bets will you place? Will the size of your bet increase or decrease? For our example, we'll use the following setup:
- We'll call our strategy "Dark Corner".
- Each round, we'll place a corner bet and a bet on black.
- The initial bet amounts will be $1.00 for the Corner bet and $2.00 for the Black bet.
- If we lose a round, the bet amounts will stay the same.
- If we win, we’ll double our bets.
- If we win two rounds consecutively, we’ll reset to the original bet amounts and start again.
You'll want to start by defining your own parameters in a similar fashion. We’ll continue with this example, but your own setup should be tailored to your specific strategy.
- 2
Step 2 – Open Google Sheets. Fire up Google Sheets and create a new spreadsheet. You’ll want to add two separate tabs. The first tab will be where we run our simulation, and the second tab will track the results of our simulated players. This setup allows us to generate charts and analyse outcomes in various ways.
- 3
Step 3 – Label Columns A & B. On the first tab, label column A as "Bet Outcome". This column will record the results of each bet. We’ll use three values: 1, 2, and 0. A ‘1’ indicates a win on the black bet, a ‘2’ indicates a win on the corner bet, and a ‘0’ indicates a loss.
Next, name column B "Winning Chances". Here, we’ll list the probability of each outcome in column A. We'll use the following probabilities: black bet - 48.60%, corner bet - 10.80%, and a loss - 40.60%. This means that the overall chance of winning any spin with one of our bets is 59.40%, while the chance of losing is 40.60%.
- 4
Step 4 – Label Columns C & D. Continue by naming column C "Cumulative Probability". You should enter the formula =SUM($B$2:B2) in the second cell. Drag this formula down to apply it to the rest of column C. This will ensure that the cumulative probability of all outcomes does not exceed 100%.
Column D will be labelled "Spin Count". Here, enter the total number of spins you want the simulation to run. We’ll input 1,000 to simulate 1,000 spins.
- 5
Step 5 – Add a Random Number Generator to Column E. For column E, name it "Random Selector". This is a crucial step, as we’ll use this column to implement a random number generator (RNG). In cell E2, input the following formula: =INDEX(A$2:A$4,COUNTIF(C$2:C$4,"<="&RAND())+1. This formula checks how many values in column C are less than or equal to a random number generated by the RAND function, then picks the corresponding value from column A. This simulates a random outcome for each spin.
With our RNG in place and our probabilities set, the next task is to incorporate the bet progression system into our simulator.
- 6
Step 6 – Set Up a Betting Column. Label column F as "Bet Amounts" and enter the base total bet in cell F2. For this example, we’ll enter “3”, which is the sum of the initial Corner and Black bet amounts ($1.00 + $2.00 = $3.00). In F3, input the following formula: =IF(E2=0, F2, IF(AND(OR(E2=1, E2=2), OR(E1=1, E1=2)), $F$2, F2*2)). This formula dictates the bet progression based on previous wins or losses. You can adjust this formula to better fit your own betting strategy.
- 7
Step 7 – Create a Bankroll Tracking Column. Name column G "Bankroll". This column will track changes to your balance over time. In G2, enter your starting bankroll (we’ll use 1,000 as an example). Then, in G3, enter the formula: =IF(E3=0, $G$2-F2, IF(E3=1, $G$2+F2, IF(E3=2, $G$2+F2*11, $G$2))). This formula adjusts the bankroll based on the outcome of each spin and resets the betting cycle when required.
Once everything is set up, your Google Sheet should resemble this layout:

- 8
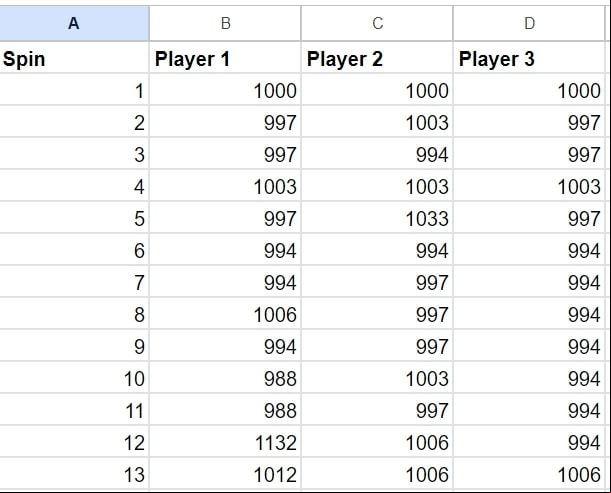
Step 8 – Move to the Second Tab. With the simulator now complete on the first tab, shift over to the second tab where we’ll track our virtual players’ results. Start by naming column A "Spin Number". Then, label columns B, C, and D as "Player 1", "Player 2", and "Player 3". Feel free to add more columns for additional players if needed.
- 9
Step 9 – Copy Data from the First Tab. Copy the "Spin Count" data from the first tab into the "Spin Number" column on the second tab. Similarly, copy the "Bankroll" values from the first tab’s column G into "Player 1" on the second tab. to use Ctrl+Shift+V to paste only the values, not the formulas.
To simulate multiple players, go back to the first tab, adjust the RNG column (column E) to generate a fresh set of random numbers, and copy the new bankroll data into "Player 2" on the second tab. Repeat this for "Player 3". This will give you different bankroll trajectories for each player, simulating multiple runs of the strategy. Your spreadsheet should now look like this:
- 10
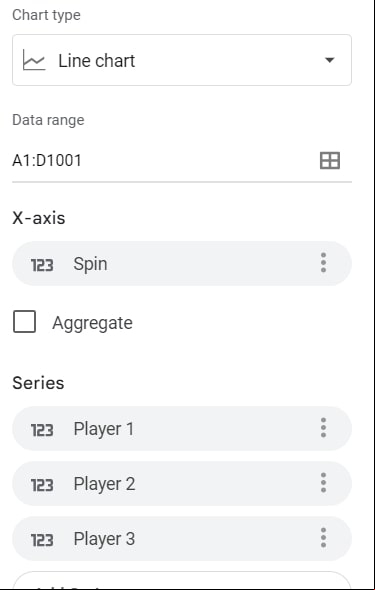
Step 10 – Create a Chart to Visualise Results. To visualise the results, we’ll create a chart showing how the bankrolls fluctuate over time. Select a cell on the second tab, then click "Insert" > "Chart" from the top menu in Google Sheets. A blank chart will appear, and you can customise it using the options on the right. Set up the chart to reflect the data series for all players as shown in the example below:
Now, your chart will provide a visual summary of how each player performed throughout the simulation. For example, using our "Dark Corner" strategy, the results were:
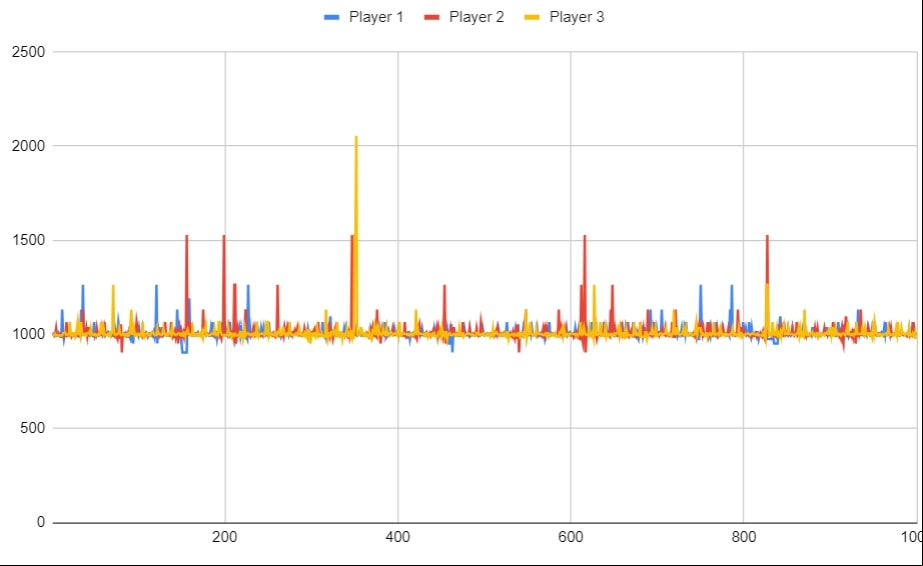
Our strategy showed promising results: Players 1 and 2 ended up with a bankroll of 997 after 1,000 spins, meaning they lost only 3. Player 3 had a final bankroll of 976. Each player experienced moments where they could have walked away with a profit if they had chosen to stop. This chart allows you to assess whether your strategy is profitable and where adjustments might be necessary.